
Visuals that accompany information are always a great tool and have been proven to improve information recall rates in both children and adults. This week in class, we learned how to incorporate this in a classroom through the use of sketchnoting and Canva.
Sketchnoting is a note-taking strategy that includes information and visuals to help learners retain information better. They can often be seen as flowcharts, mind-maps, picture drawings, or other visual elements. Here is an example of a sketchnote I did.
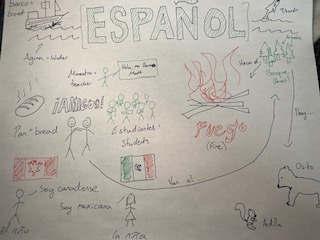
In the elementary classroom setting, I think that sketchnoting is such a great skill for students to learn. For this, I want to focus on how it will benefit students at a higher grade level. For one, it makes the note taking process multitudes more fun as students can add all sorts of creative flair to their notes. And according to what we learned in class, the use of visuals vastly increased the retention rate of information among students. This would be exceptionally useful if students are taking a test or other form of assessment and need to quickly recall information. They could do so simply by remembering a picture or visual that they drew and what information was associated with that image. Sketchnoting would have definitely helped me throughout my schooling years, so I hope to pass that tool on to my future students.
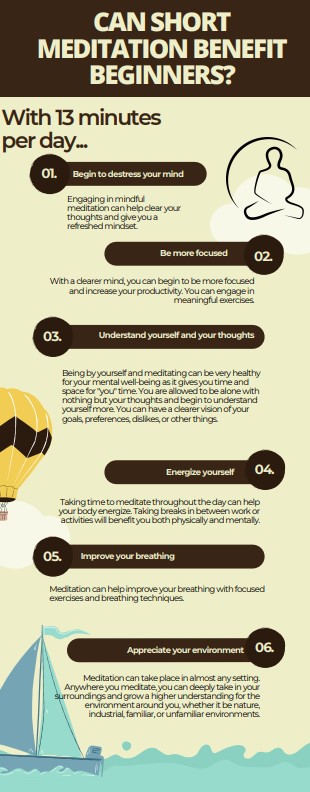
The second form of visually appealing sources of information that we discussed was Canva. Canva is a free online program that allows you to make infographics using a multitude of templates. I had never used Canva before our class, but it is a tool that I see myself frequenting in the future. It’s got a wide variety of possibilities from information sheets to worksheets, and they are all entirely customizable. To the right is just an example of what a Canva infographic could look like. As you can see, notes are condensed and easy to read, and visuals can be added to give your infographic a nice finish. The interface is also very user friendly, however some features are only accessible to premium users who must pay a monthly subscription fee. Regardless, you can still get much use out of the free version and I definitely recommend using Canva to teachers, whether it be for presentations, handouts or assessment tools.
The last point I want to briefly talk about today is the SAMR (substitution, augmentation, modification, redefinition) model. This model is used to evaluate technology within classrooms by determining how exactly that technology impacts learning. I think that consulting this when implementing new technology in the classroom is a must. By understanding the model, teachers can determine at what level the technology they want to implement falls on. From there, they can decide whether it is appropriate to do so or if the investment will be purposeful.
That’s everything for this week and I look forward to what technologies we will be exploring next!